An in-depth interpretation of the Nolan Chart in Political Compass: The two-dimensional political spectrum model tests whether you are left or right
The Nolan Chart is a two-dimensional political spectrum model proposed by libertarian David Nolan in 1971. The NolanChart political compass test can test whether you are left or right and more accurately divide political ideological tendencies. This guide will introduce in detail the four quadrants of the Nolan Curve and the political positions they represent, and help you understand how to use this tool to conduct political value ideology tests to discover your own political coordinates.
When discussing political ideology, the traditional one-dimensional political spectrum division system of "left" and "right" is often considered by political scientists to be too simple and insufficient to describe existing changes in political beliefs. Such one-dimensional divisions often fail to clearly identify those who hold conflicting positions on economic and personal freedoms. To address this limitation, libertarian David Nolan published an innovative political spectrum test chart, the Nolan Chart, in the monthly magazine "The Individualist" in August 1971. With its dual-axis design, the Nolan Curve divides people's political positions into four different quadrants, providing a more comprehensive and detailed political analysis framework.
This site provides the NolanChart political compass test , which can help you understand whether your political values are left or right. For readers who are interested in learning more about their own political positions, many online political tests, such as the 8 Values political orientation test , the 9 Axes political ideology test , the LeftValues left-wing political values test , and the RightValues right-wing political spectrum test , all use a theoretical framework based on the Nolan Curve or a similar dual-axis model to help individuals discover their own political coordinates.
The core dimensions of the Nolan Chart: economics and personal freedom
The core of Nolan Chart lies in its two-dimensional space design. It abandons the traditional single straight line division, but uses two mutually perpendicular axes, representing two different dimensions of freedom:
- Horizontal abscissa axis: economic freedom
- Definition : Economic freedom refers to the degree to which an individual can protect his or her business, property, or income from others. It measures the extent to which individuals can produce and trade goods and services without government interference.
- The low economic freedom end tends toward strong government regulation, including high taxes, trade barriers, controls on business activities, and funding of social welfare systems.
- The high economic freedom end leans toward free market capitalism and advocates the removal of government controls, such as lowering tax rates, reducing trade barriers, and reducing business controls.
- Vertical vertical axis: personal freedom
- Definition : Personal freedom measures the extent to which a person can engage in specific behaviors without interference. This includes the exercise of religious belief, freedom of expression, and the freedom to move freely and/or associate with others.
- The low personal freedom end advocates that the authorities regulate people's personal behavior to maintain social order, and tends to increase restrictions on personal behavior.
- The high individual freedom end advocates maximizing protection of individual freedom rights, such as freedom of speech, privacy, and separation of church and state.
The Nolan Curve attributes differences in political ideology to different combinations of support for these two freedoms, thereby dividing political positions into four core quadrants.
An in-depth analysis of the four political quadrants of the Nolan Chart
The Nolan Chart depicts four main types of politics through the intersection of the two dimensions of economic freedom and personal freedom.
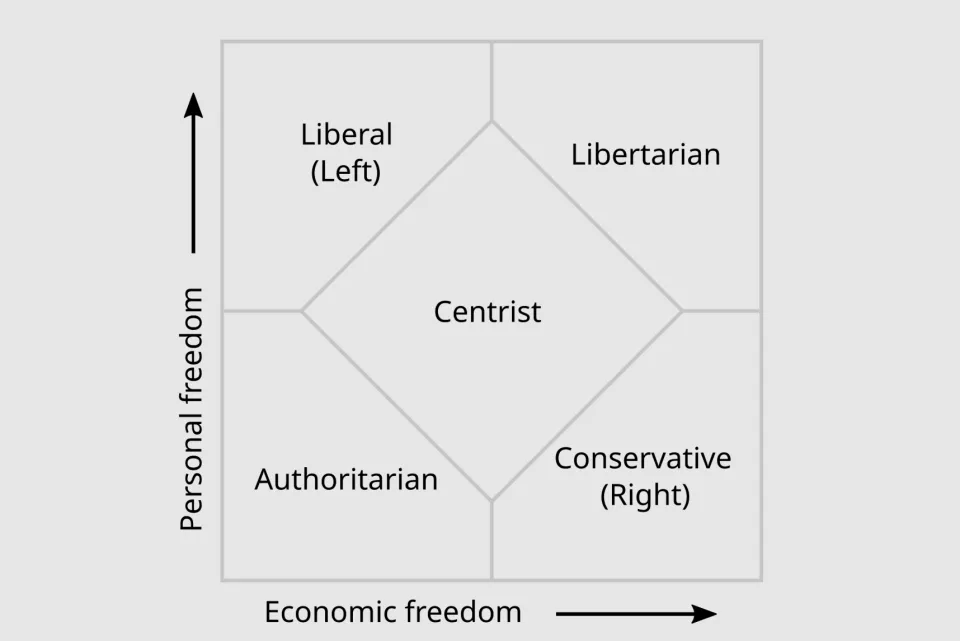
Upper right quadrant: libertarianism
Libertarians score highest on the Nolan Chart, embracing both economic freedom and personal freedom .
- Core proposition : Libertarianism advocates the removal of government regulation on almost everything and replacing it with individual responsibility and responsibility. They support laissez-faire government and believe that government regulation should be limited to preventing someone from causing harm to the life, liberty, or property of others.
- Economic outlook : They attach great importance to entrepreneurship and enterprise development, believing that this is the basis for social prosperity.
- Personal outlook : They are passionate about protecting the right of individuals to pursue happiness, no matter how different the forms of that pursuit.
- Views on government : Due to their high emphasis on economic and personal freedom, they are skeptical of the government's power to monopolize violence and tend to limit or eliminate government altogether .
Upper left quadrant: modern liberalism and progressivism
This quadrant represents modern liberalism (sometimes called left-wing politics or Progressivism ), which typically embraces greater personal freedoms but limits economic freedoms .
- Core Claim : Modern liberals tend to embrace the value of individual choice, but relatively little in terms of private property rights, investment, production, and exchange.
- Economic outlook : They tend to increase government control over trade and commerce, fund the social welfare system through taxation, and advocate the redistribution of wealth. Many progressives believe that the capitalist system tends to lead to the exploitation of the weak by the strong.
- Personal views : They tend to protect individual freedoms and do not support restrictions on personal freedoms such as freedom of speech, sexual issues, and beliefs. In the contemporary context, this group usually actively promotes social justice and minority rights, such as sexual/gender equality, which makes some phenomena that are socially progressive but combined with the market economy (such as "rainbow capitalism" or "pink capitalism" ) relevant to the social stance of this quadrant.
- Political Spectrum Test Application : This stance is particularly prominent in tests that measure left-wing value orientations, such as the LeftValues Left-Wing Political Values Test , which typically delve into the subject's specific tendencies toward social justice and economic intervention.
Lower right quadrant: conservatism
This quadrant represents Conservatism (or right-wing politics ), which usually supports more economic freedoms but limits personal freedoms .
- Core Claim : Conservatives generally support honest entrepreneurship and free enterprise, but believe that excessive individual freedom breeds widespread immorality and can lead to the decline of a culture or civilization.
- Economic views : They tend to support capitalism and advocate the removal of government regulations, such as lowering taxes and reducing controls on business practices.
- Personal outlook : They tend to increase restrictions on personal behavior, such as censorship, blue laws (forbidding non-religious behavior on Sundays), sexual issues, marriage, moral laws, and emphasize the enforcement of property crimes and moral codes. They generally value law and order and tend to support broader police powers.
- Political spectrum test application : This position highly overlaps with the values focused on by the RightValues right-wing political spectrum test , involving core concepts such as tradition, order, and economic freedom.
Lower left quadrant: statism or totalitarianism
The lower left quadrant represents statism , which Nolan might have initially described as populism, but is more appropriately described as statism or totalitarianism, which advocates restrictions on both economic freedom and individual freedom .
- Core Claim : Ethnic groups in this group favor government restrictions on almost everything, advocating strict government control over individuals and the economy because they believe such control is more likely to achieve an ideal society.
- View of freedom : They believe that autonomous individuals are a threat to the overall order. Social planners cannot tolerate excessive diversity of opinion or any expression that challenges or calls into question their authority.
- Economic View : Authoritarians are opposed to free enterprise. Economically, this position can manifest itself as corporatism or fascism (tolerating private enterprise but requiring it to serve state purposes), or as socialism (state control of all means of production, no private enterprise tolerated).
- Form of Government : This includes dictatorship, theocracy , fascism , communitarianism, or an unrestricted democracy that lacks constitutional and electoral restrictions. It may adopt extreme policies such as nationalization of industries, planned economy, suppression of political dissent, travel restrictions, and censorship of the media.
- Political spectrum test application : In more complex political models, such as the 9Axes political ideology test , the "authority" and "centralization" dimensions involved in this quadrant will be dismantled in more detail.
Middle zone: Moderate
The moderates at the center of Nolan's chart (sometimes called "centrists" or "centrists") score neither high nor low on economic freedom and personal freedom.
- Core traits : They tend to be pragmatic, or think about specific issues on a case-by-case basis. They may hold extreme views on one issue but not on another.
- Position Tendency : Moderate leanings can "lean" toward progressives, conservatives, libertarians, or authoritarians, but usually not to extremes.
➡️ Click the link to take the NolanChart Political Compass Test now
Application and academic controversy of Nolan Chart
Applications and changes of Nolan charts
The Nolan Chart and its cousin, the Political Compass , have become a core tool in many online political self-tests . These political tests ask subjects for their opinions (for, against, or neutral) on a series of issues related to personal freedom and economic freedom. The combined responses place the subject at a point on a chart that indicates their leanings toward political parties and forms of government.
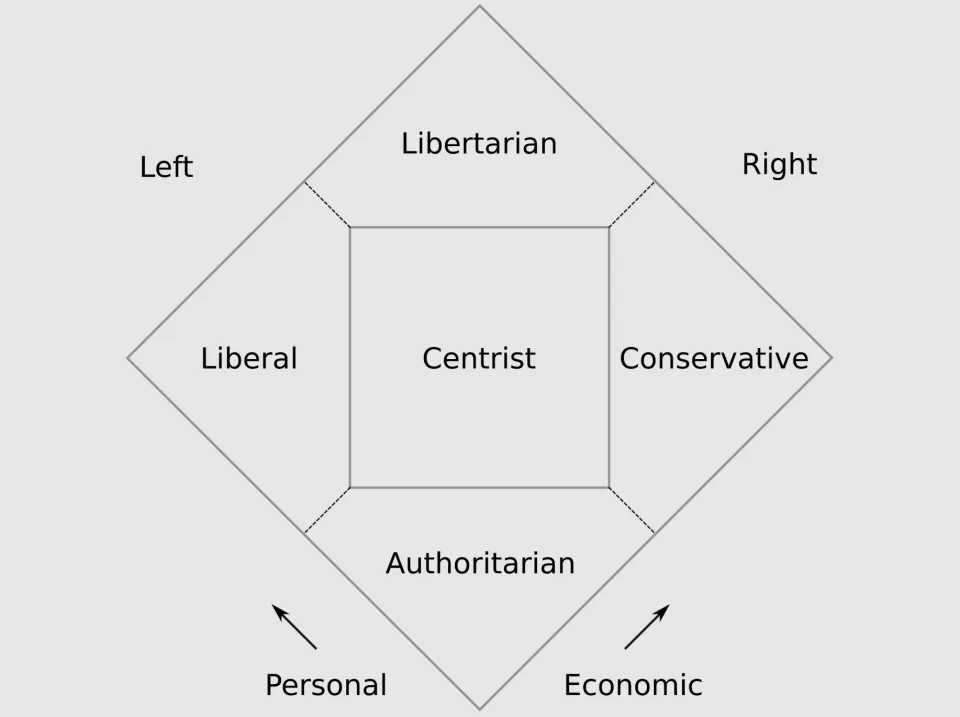
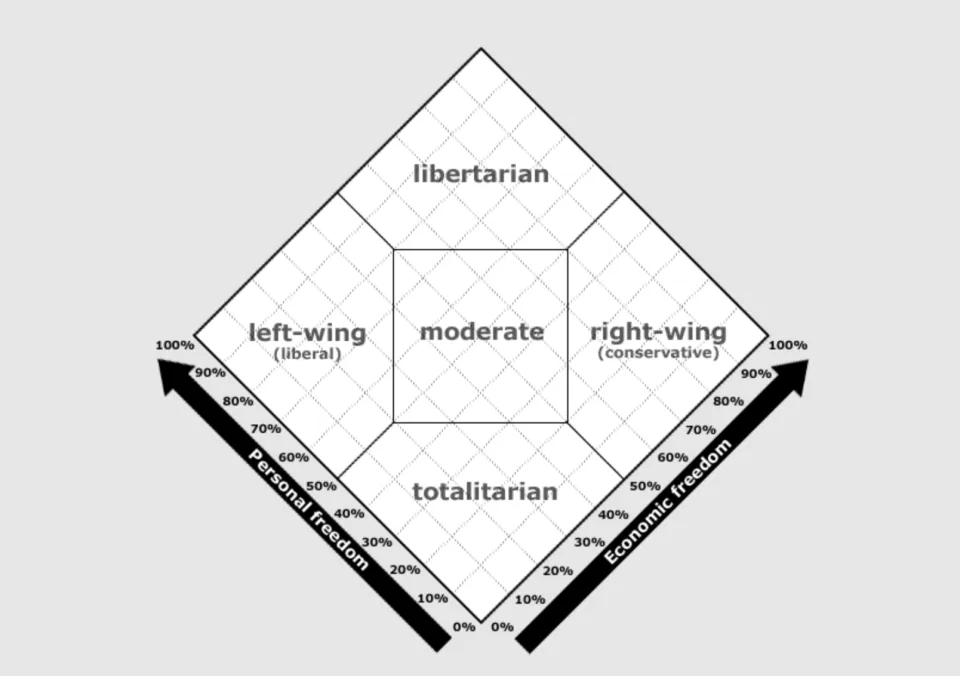
Many variations of the Nolan Chart have been developed, such as a diamond shape rotated at a 45-degree angle, to more closely match people's conventional perceptions of the traditional left/right wing.
The professional debate over the Nolan Chart
Despite its important role in popularizing knowledge about the political spectrum, the Nolan Chart has also faced some criticism and controversy.
- Oversimplification : Critics argue that the Nolan chart, like other political charts of its kind, is a pseudoscientific depiction of political opinion because it oversimplifies complex political ideologies. However, this simplification is obviously not as serious as the one-dimensional "left-right" spectrum.
- Definition of the concept of freedom : Critics point out that economic freedom and personal freedom often cannot be neatly separated in practice. For example, social democrats who support gun control (generally viewed as a low personal liberty leaning on the chart) may believe that reducing guns on the streets contributes to personal safety and thus maximizes personal liberty for all citizens. Likewise, in debates on social issues such as abortion, both sides may claim that their positions maximize freedom for all, making the distinction between “liberal” and “dictatorship” of limited use.
- Issues with the economic dimension : The “economic freedom” axis (X-axis) of the Nolan Chart is the choice between strong government regulation (low economic freedom) and free market capitalism (high economic freedom). This design completely ignores the existence of non-capitalist economic formations such as liberal socialism or anarchism. Although these ideologies do not want government intervention in the economy, they fiercely oppose the privatization of production tools and advocate direct joint control of the economy by workers. Although they see themselves as promoting economic freedom, the Nolan chart takes the view of capitalists, positioning them at the low economic freedom end.
- Purpose Questioning : Some critics believe that the purpose of Nolan's diagram may be to separate "libertarianism" from other ideologies such as anarchism and socialism.
All in all, the Nolan Chart, as an important political compass two-dimensional political spectrum analysis tool, has greatly enriched our understanding of political ideology and inspired subsequent political test models, including various popular tests that you can learn about on the official blog of this site, such as the Eight Values political orientation test , etc. It provides an intuitive framework to help people find their place at the intersection of economic and personal freedom.